Plant Growth (NDVI)
The Plant Growth reports utilize the NDVI layer give you no cost access to the Sentinel 2 satellite data. NDVI, which refers to Normalized Difference Vegetation Index, is the most widely used index to present relative vegetation biomass. NDVI is a formula using near-infrared and visible red reflectance to come up with an index number representing a designated area which can be compared to other areas to show relative biomass. Multiple reports are available for comparison and the data can be exported as GeoTiffs and JPEGs.
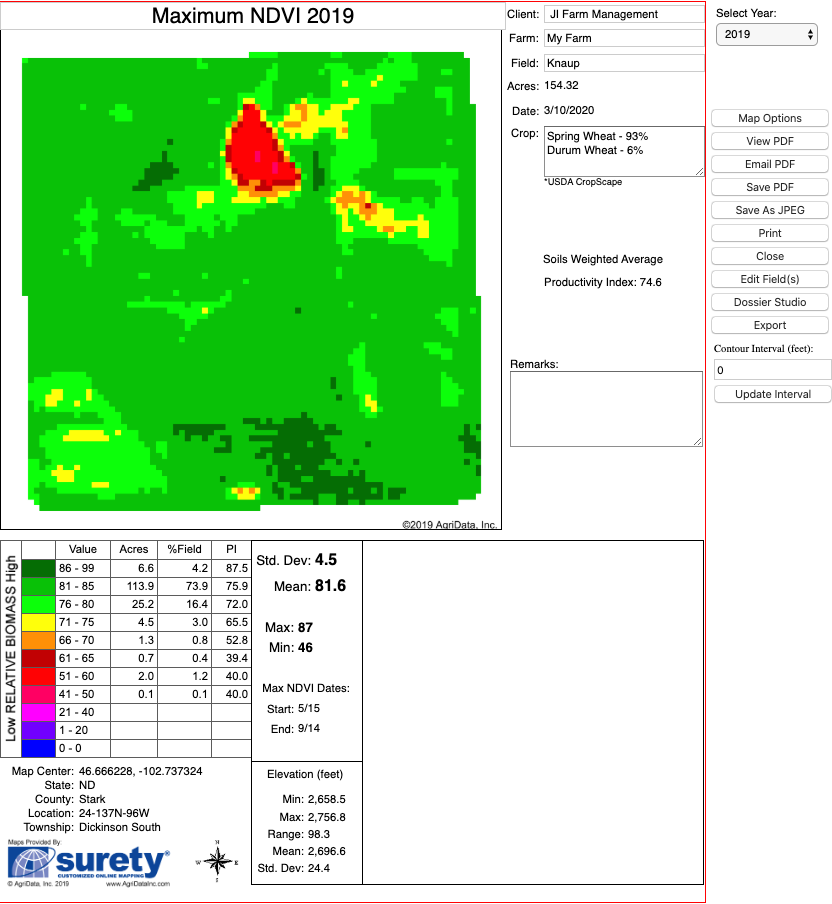
Plant Growth by Year
This report shows the Max NDVI for a given year. Max NDVI refers to the maximum NDVI value for each 10x10 square meter area for the growing season. Since Sentinel readings are taken every 5 days since 2018 (every 10 in 2017), we are able to search through each growing season of data and find the highest NDVI value for each 10 x 10 meter square within an area(field). This means that the Max NDVI maps have data from potentially many different dates.
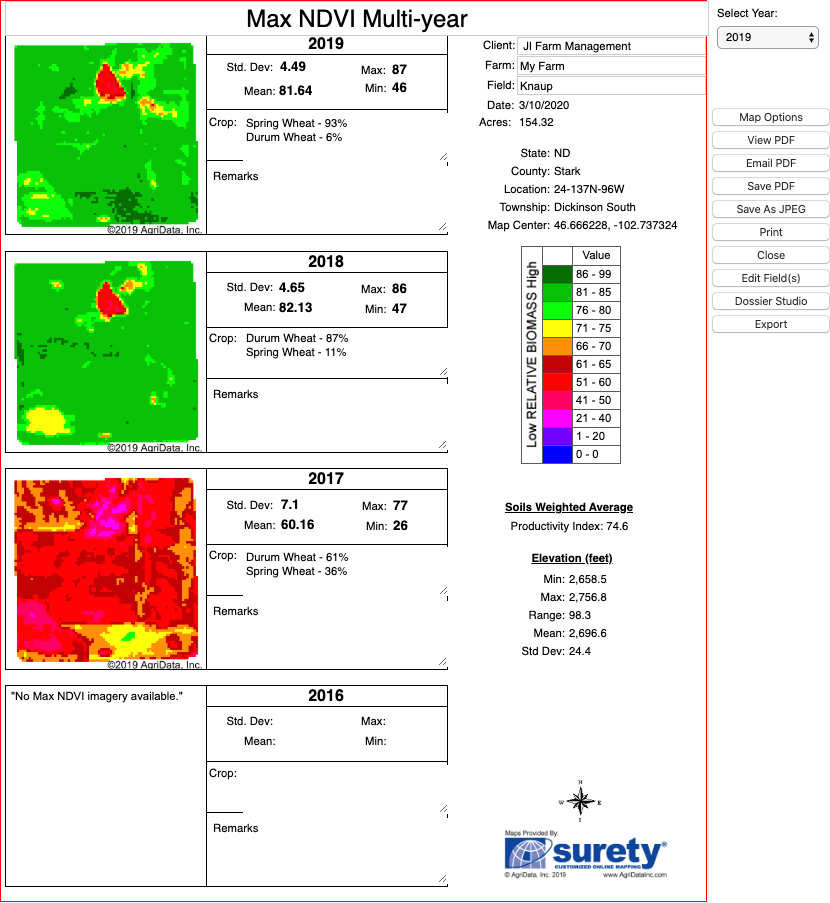
Plant Growth Multi-year
This report shows the NDVI Max for up to 4 years. 2017 is the first year data is availabe.
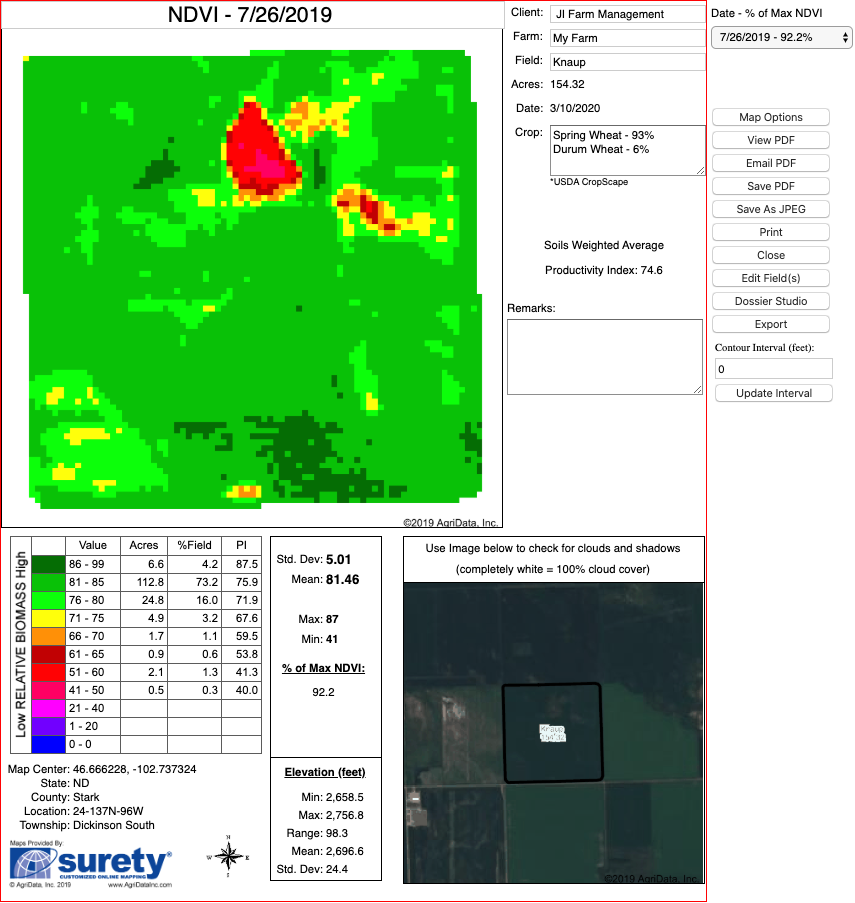
Plant Growth Single Date
This report displays NDVI data for individual dates within the selected or drawn area. It also gives a true-color image of the area around the boundary of interest for cloud determination.
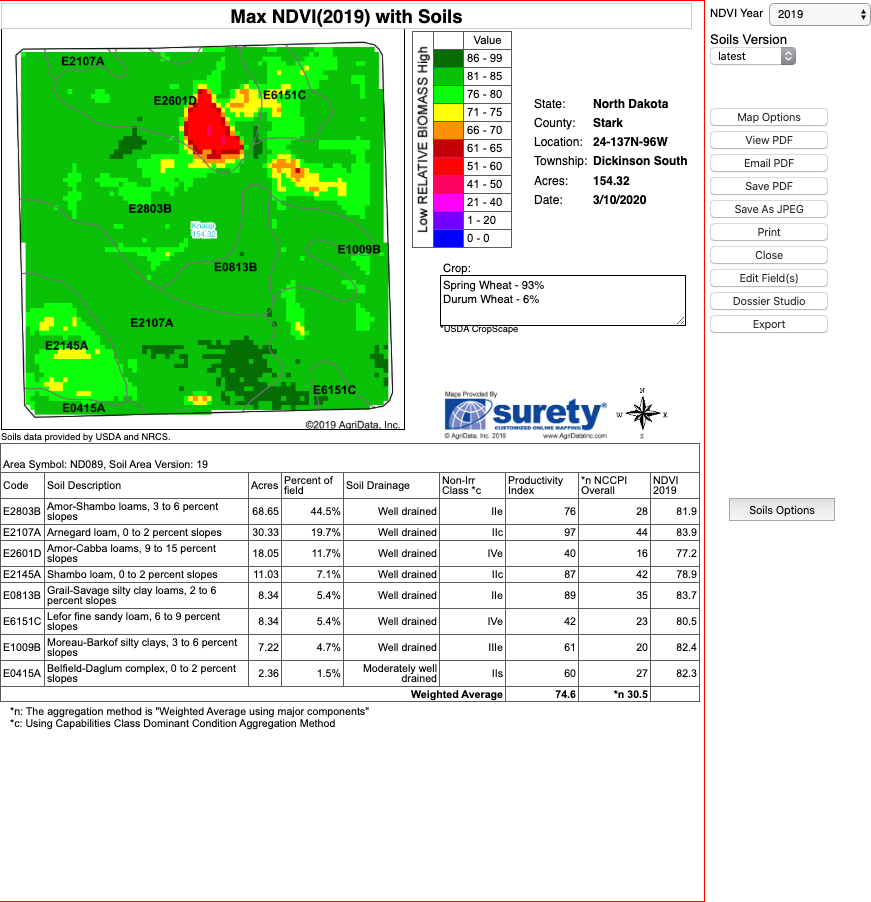
Plant Growth Soil Map
A very informative report that displays a comparison of the yearly Max NDVI and the soil properties for a selected area, including productivity index, CSR2, Bulletin 811 data, and more.
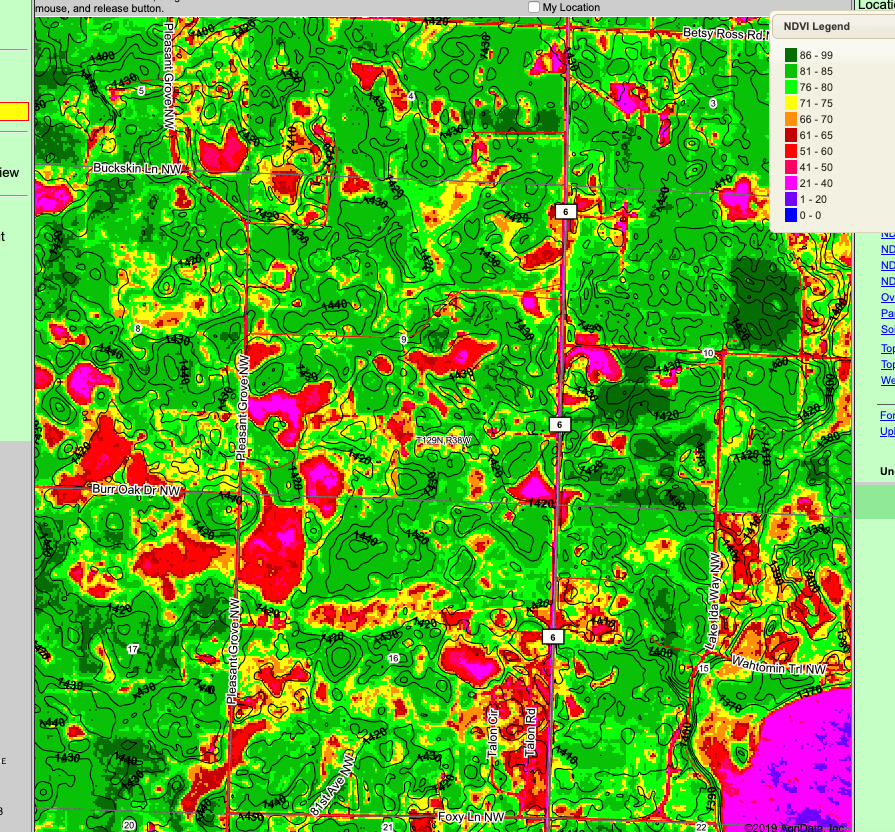
NDVI Layer
This layer, called the Maximum NDVI, will allow the Max NDVI for a chosen year to be represented on the main map interface, approximately a 2x2 mile area. (Shown, at left, with overlying topography contours).